Onchain impact metrics for Optimism Retro Funding 4

Open Source Observer is working with the Optimism Collective and its badgeholder community to develop a suite of impact metrics for assessing projects applying for Retro Funding 4.
Introduction
Retro Funding 4 is the Optimism Collective’s first experiment with Metrics-based Evaluation. The hypothesis is that by leveraging quantitative metrics, citizens are able to more accurately express their preferences for the types of impact they want to reward, as well as make more accurate judgements of the impact delivered by individual projects.
In contrast to other Retro Funding experiments, badgeholders will not vote on individual projects but will rather vote via selecting and weighting a number of metrics which measure different types of impact.
The Optimism Foundation has published high level guidance on the types of impact that will be rewarded:
- Demand generated for Optimism blockspace
- Interactions from repeat Optimism users
- Interactions from Optimism users with high trust scores / onchain reputations
- Interactions of new Optimism users
- Open source license of contract code
The round is expected to receive applications from hundreds of projects building on six Superchain networks (OP Mainnet, Base, Frax, Metal, Mode, and Zora). Details for the round can be found here.
At Open Source Observer, our objective is to help the Optimism community arrive at up to 20 credible impact metrics that can be applied to projects with contracts on the Superchain.
This page explains where the metrics come from and includes a working list of all metrics under consideration for badgeholders. We will update it regularly, at least until the start of voting (June 23), to reflect the evolution of metrics. The first version metrics was released on 2024-05-16 and the most recent version (below) was released on 2024-06-24.
Data Model
This section explains where the underlying data comes from and how it gets transformed.
One thing to make crystal clear is that Open Source Observer relies 100% on public datasets, meaning anyone can verify the integrity of the source data. All of our code is open source, so anyone can audit our models and query logic. Finally, even our data pipelines and indexing infrastructure is open to the community, so you can run your own experiments, train your own models, even connect your own data sources! You can read about OSO’s commitment to open source, open data, and open infrastructure here.
Data Sources
The following raw data sources will be used:
- L2 Blockchain Transactions and Traces (OP Mainnet, Base, Frax, Metal, Mode, Zora), powered by GoldSky
- Web3 Social & Identity (Farcaster, Passport, EigenTrust by Karma3Labs, and potentially other NFT or attestation-related credentials)
- Open Source Code Contributions (GitHub, OSS Licenses)
- Project Applications (submitted on Agora)
There is additional data available on OSO, including software dependencies, grant funding histories, data on other chains, etc, which is open for exploration but will not be incorporated into impact metrics for RF4.
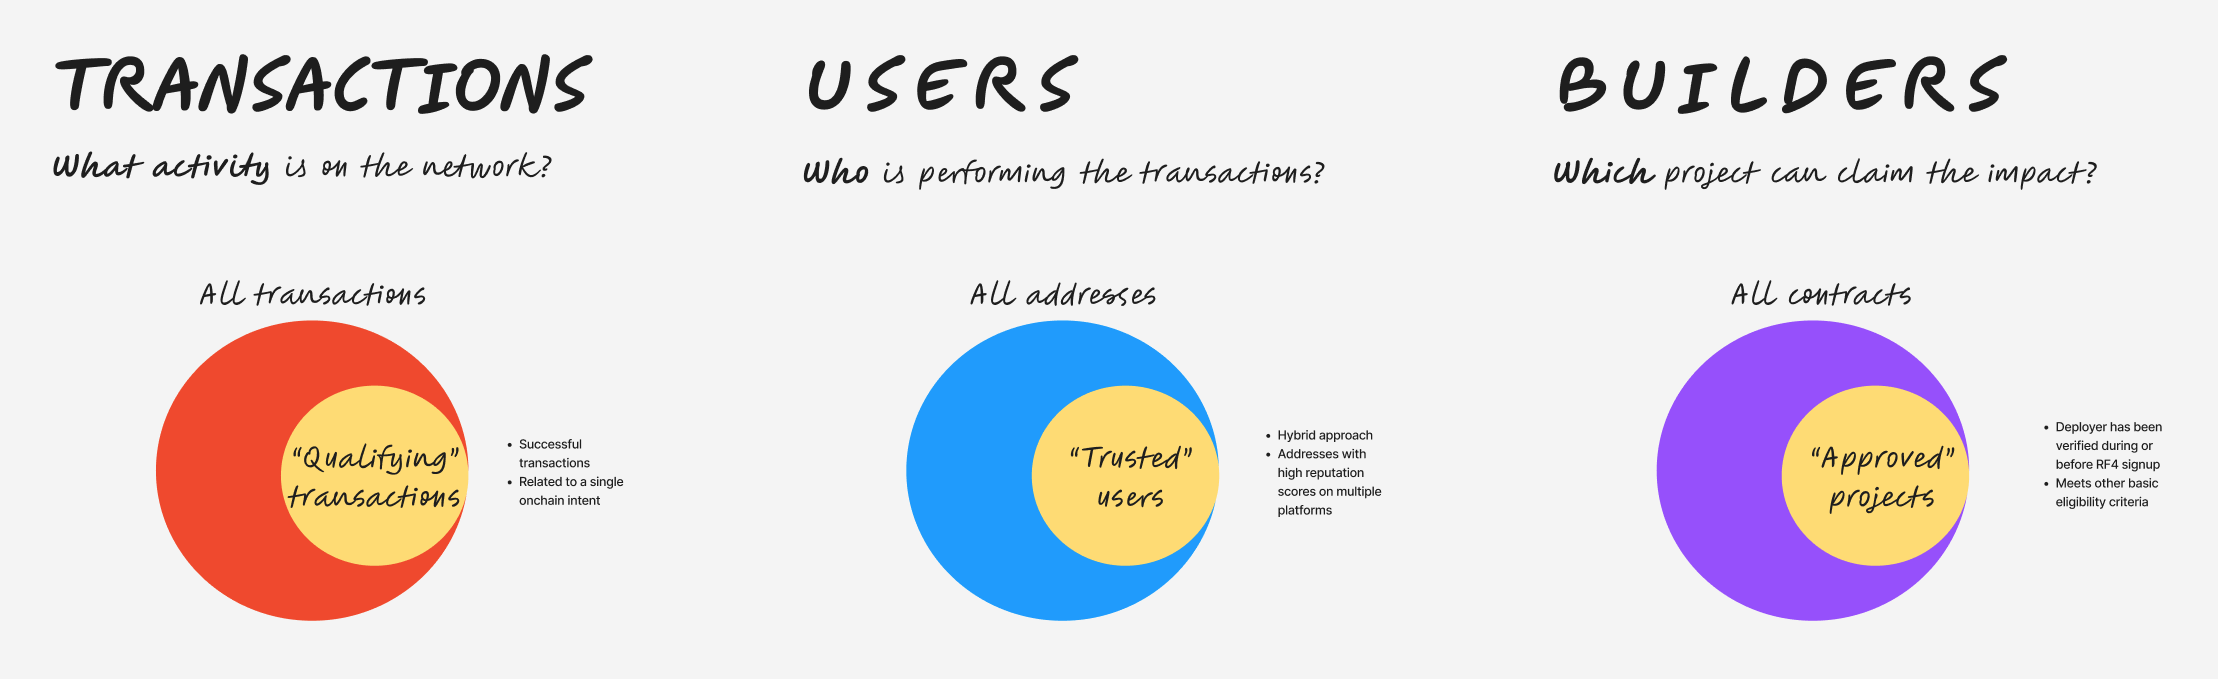
Transformations
For each data source, we are working with partners to create filters that can be applied to the data.
For metrics that look at transactions, we are collaborating with the OP data team to define filters on “qualifying” transactions. For metrics that look at addresses, we are working on a definition of a “trusted” user, which considers reputation data from multiple platforms. For the projects themselves, there are filters to include only projects and contracts that are “approved” by the Foundation’s acceptance criteria and verified through the sign-up flow on Agora.
The definitions and query logic for each impact model is available here. The underlying SQL/dbt is available on our GitHub here and can be simulated in a data science environment by following the docs here.
Metrics Framework
Together with the Optimism badgeholder community, we are organizing metrics into four categories: network growth, network quality, user growth, and user quality.
These categories are illustrated in the matrix below, including some examples.
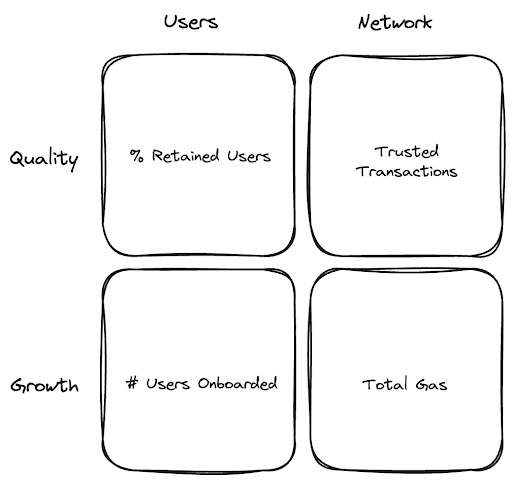
These categories are intended to counterbalance each other. The optimal strategy for a project should be to excel on multiple dimensions, not just one.
A project should want to grow its total gas contribution but also keep the number of trusted transactions as high as possible. A project should want to onboard lots of users but also retain as many users as possible. It’s very hard to game multiple, opposing metrics.
As badgeholders will be voting on portfolios of metrics, not projects, the projects that perform the best in RF4 will find themselves somewhere on the efficient frontier of quality vs growth metrics.
Metric Logic
Each metric will be expressed as a SQL model running on top of the underlying data, with some intermediate models to improve readability. One of the core models is called rf4_events_daily_to_project, which is a daily snapshot of all events on the Superchain tagged by project up until the end of the RF4 window (2024-06-01).
Here’s an example of gas fees:
select
  project_id,
  'gas_fees' as metric,
  SUM(amount / 1e18) as amount
from `opensource-observer`.`oso`.`rf4_events_daily_to_project`
where
  event_type = 'CONTRACT_INVOCATION_DAILY_L2_GAS_USED'
group by
  project_id
The query above grabs all gas-generating events on the Superchain from RF4-approved projects and sums up their gas fees.
Trusted User Model
Onchain events are also tagged with a trusted_user_id if the address that triggered the event is considered a trusted user.
A "trusted user" represents an address linked to an account the meets a certain threshold of reputation. Currently, there are several teams in the Optimism ecosystem building reputation models in a privacy-preserving way. This metric aggregates reputation data from multiple platforms (Farcaster, Passport, EigenTrust by Karma3Labs), and the Optimist NFT collection. In order to be consider a trusted user, an address must meet at least two of the following requirements as of 2024-05-21: have a Farcaster ID of 20939, have a Passport score of 20 points or higher, have a Karma3Labs EigenTrust GlobalRank in the top 42,000 of Farcaster users, hold an Optimist NFT in their wallet, or qualified for at least two (out of four) Optimism airdrops.
Here is an example of a model that looks only at successful transactions from trusted users since 2023-10-01:
select
  project_id,
  'trusted_transaction_count' as metric,
  SUM(amount) as amount
from `opensource-observer`.`oso`.`rf4_events_daily_to_project`
where
  event_type = 'CONTRACT_INVOCATION_SUCCESS_DAILY_COUNT'
  and bucket_day >= '2023-10-01'
  and trusted_user_id is not null
group by
  project_id
Once again, all of the source code is available from our repo here. We recently wrapped a data challenge to get analysts’ input and additional proposals for impact metrics.
Current Metrics
This section will be updated regularly to reflect the latest metrics under consideration for RF4. These metrics will be calculated for all projects on the Superchain that verify at least one public GitHub repo and one deployer address (and that are approved in the application process).
Gas Fees
Sum of a project's total contribution to gas fees across the Superchain over the RF4 scope period (October 2023 - June 2024).
Gas fees are the primary recurring revenue source for the Superchain and a key indicator of aggregate blockspace demand. A project’s gas fee contribution is influenced by its total volume of contract interactions, the computational complexity of those interactions, and the state of the underlying gas market at the time of those transactions. In the long run, gas fees are what will power Retro Funding and enable it to continue in perpetuity. All members of the Superchain have committed at least 15% of their gross profit from gas fees to Retro Funding. Supporting projects that generate revenue in the form of gas fees helps power the economic engine of the Superchain.
Total Transactions
Count of a project’s transactions over the RF4 scope period (October 2023 - June 2024).
Optimism is a Layer 2 roll-up designed to improve the transaction throughput and reduce the fees on Ethereum. Layer 2s are crucial for scaling Ethereum because they help address the network's congestion issues without compromising its security or decentralization. Transaction counts are an important indicator for assessing the adoption and usage of all the new blockspace made available by the Superchain. Projects that have a sustained, high transaction count provide a clear signal of network growth and blockspace demand.
Interactions from Trusted Optimism Users
Count of a project’s transactions performed by trusted users over the RF4 scope period (October 2023 - June 2024).
Bots, airdrop farming, and sybil attacks are longstanding problems in crypto. This metric is designed to filter out these types of interactions and focus on the activity of a small subset of trusted users (less than 5% of all active addresses on the Superchain). By tracking interactions specifically from trusted users, we gain a picture of blockspace demand that is less influenced by the effects of bots / farmers / sybils.
See the Trusted User Model section above for more information on how trusted users are defined.
Trusted Optimism Users' Share of Total Interactions
Percentage of a project's total transactions that were made by trusted users over the RF4 scope period (October 2023 - June 2024).
This metric expresses Interactions from Trusted Optimism Users and Total Transactions as a simple ratio. Using a ratio makes it easier to compare trusted user levels across big projects and small projects side-by-side. For example, a project with 10K trusted transactions out of 20K total transactions would score better than a project with 10K trusted transactions out of 50K total transactions. This indicator is nuanced because it recognizes that minimizing bot / farming / sybil activity might go against economic incentives in the short term but is important for network quality in the long term. Given that this indicator is calculated on a percentage basis, projects with fewer than 100 users are not evaluated.
See the Trusted User Model section above for more information on how trusted users are defined.
Users Onboarded
Count of trusted users to the Superchain who were onboarded over the RF4 scope period (October 2023 - June 2024) and who interacted with a project within their first 30 days on the Superchain.
Getting 1 billion users onchain won’t be easy. It will require better onramps and onchain UX than crypto natives are accustomed to. This metric identifies projects that helped onboard new, "trusted users" to the Superchain since October 2023. In order to qualify, a new user has to also be in the set of trusted users. Then, any project on any chain that a user interacted with in their first month on the Superchain is counted. This is often multiple projects per new user. Supporting projects that are the first port of call for new users is essential for expanding the size and reach of the Superchain user’s base.
See the Trusted User Model section above for more information on how trusted users are defined.
Average Daily Active Addresses (DAAs)
Average of a project’s daily active addresses over the RF4 scope period (October 2023 - June 2024).
Daily Active Addresses (DAAs) is a more granular view of a project's daily user activity and engagement levels than MAAs (Monthly Active Addresses). A high number of DAAs is a sign that Layer 2s have widespread adoption. While there is minimal cost to creating new addresses to farm a protocol, such farming or Sybil activity is usually short-lived. By averaging the number of active addresses on a daily basis over the RF4 period, this metric smooths out some of the blips and spikes in the data. New projects receive 0s for the days before they launched. Steady or rising DAAs over an extended period is a good signal of widespread adoption.
Average Trusted Daily Active Users (DAUs)
Average of a project’s daily active users (trusted users only) over the RF4 scope period (October 2023 - June 2024).
Daily Active Users (DAUs) is a more granular view of a project's daily user activity and engagement levels than MAUs (Monthly Active Users). A high number of trusted DAUs would be a sign that Layer 2s have widespread adoption. The reality today is that there are very few apps that generate high levels of daily, revenue-generating activity from users. By averaging the number of active users on a daily basis over the RF4 period, this metric smooths out some of the blips and spikes in the data. New projects receive 0s for the days before they launched. Indeed, trusted DAUs is a hard metric to crack, but it truly hones in on projects that give their users a reason to come back frequently.
See the Trusted User Model section above for more information on how trusted users are defined.
Average Monthly Active Addresses (MAAs)
Average of a project’s monthly active addresses over the RF4 scope period (October 2023 - June 2024).
Not all projects have lots of daily users. Some projects are more like utilities that are used once a month or at less regular intervals. Monthly Active Addresses (MAAs) is a key metric for understanding the size and engagement of a project’s user base over a more extended period. One word of caution: as there is minimal cost to creating new addresses, MAAs may be more susceptible to farming than other metrics like Daily Active Addresses or ones that look only at "trusted users". However, by averaging the number of active addresses on a monthly basis over the RF4 period, this metric does smooth out some of the blips and spikes in the data. New projects receive 0s for the months before they launched.
Average Trusted Monthly Active Users (MAUs)
Average of a project’s monthly active users (trusted users only) over the RF4 scope period (October 2023 - June 2024).
We all know that attention is fleeting, especially in crypto. MAUs is one of the most important metrics for any project looking to grow a large user base. A project’s average MAUs also provides insights into its ongoing popularity and relevance within the Optimism ecosystem. The metric is calculated by counting the number of distinct trusted users for each month included in the RF4 scope period and then averaging the monthly totals. Newer projects receive 0s for the months before they launched. A consistent or growing base of trusted MAUs is a sign that there is a healthy, thriving community around a project.
See the Trusted User Model section above for more information on how trusted users are defined.
Recurring Addresses
Count of addresses that have interacted with the project in at least 3 separate months over the RF4 scope period (October 2023 - June 2024).
Recurring addresses are a proxy for recurring users. It is especially relevant to projects where users may explicitly choose to interact with the project from a distinct address in order to preserve their privacy. By counting the number of distinct addresses that have interacted with a project over the course of at least three distinct calendar months during the RF4 scope period, this metric provides a view of user quality that complements metrics derived from the "trusted user" model. A high count of recurring addresses signals strong project loyalty and a good user experience.
Trusted Recurring Users
Count of trusted users who have interacted with the project in at least 3 separate months over the RF4 scope period (October 2023 - June 2024).
Many crypto natives are curious to try out new protocols. But churn and user retention are major issues. Recurring users represent the most loyal and committed segment of a project's user base. This metric considers users who have interacted with a project over the course of at least three distinct calendar months during the RF4 scope period. Thus, it is intended to reflect sustained interest and ongoing engagement over time. A high count of recurring users signals strong project loyalty and a good user experience, and helps separate the fads from the future.
See the Trusted User Model section above for more information on how trusted users are defined.
Power User Addresses
Count of 'power user' addresses that have interacted with the project over the RF4 scope period (October 2023 - June 2024).
This metric reflects the degree which a project has attracted attention from the most active and engaged users on the Superchain. A power user is defined as an address that has made at least 100 transactions, across at least 10 different projects, on at least 30 days, over the RF4 scope period. A project is counted by this metric if has at least one interaction from a power user. Power users are critical early adopters for the ecosystem.
OpenRank Trusted Users
Count of addresses in the badgeholder "web of trust" who have interacted with the project over the RF4 scope period (October 2023 - June 2024).
EigenTrust, aka OpenRank, is a reputation algorithm being applied by Karma3Labs to the Farcaster social graph. To seed the "web of trust", we begin with a list of 132 badgeholder addresses, look up their Farcaster IDs (present for 68 of the 132 addresses), and use OpenRank to identify those users' 100 closest connections. The result is a set of around 5000 addresses that have the closest social connection to the badgeholder community. Finally, we counts the number of addresses in the web of trust who have interacted with a given project. Note: this is an experimental metric designed and results in an even smaller but potentially higher signal subset of users than the "trusted user" model applied elsewhere.
Logarithmic Metrics
In order to provide an additional option for voters, we are offering a logarithmic scale variant for some metrics. This adjustment involves taking the base 10 logarithm of the raw metric value plus 1 (to avoid having n/a and negative values), ie: log10(metric + 1).
Logarithmic scales are useful for metrics that span several orders of magnitude such as gas fees and transactions and have strong compounding effects. On a log scale, a project with an impact metric value of 100 (10^2) is 2X more impactful than one with a value of 10 (10^1), not 10X.
The metrics that include this transformation are:
- Gas Fees
- Total Transactions
- Interactions from Trusted Optimism Users
Badgeholders are advised to use either a log scale or a normal (linear) scale in their ballots, not both.