Explore OSO data with Python
pyoso is the best way to explore OSO datasets.
Unlike the GraphQL API, which only has access to mart models,
pyoso allows you to query the full OSO data lake, including any intermediate models.
If you haven't set up pyoso yet, please refer to the
getting started
guide to to setup your environment.
Authentication
All requests to the OSO API must be authenticated.
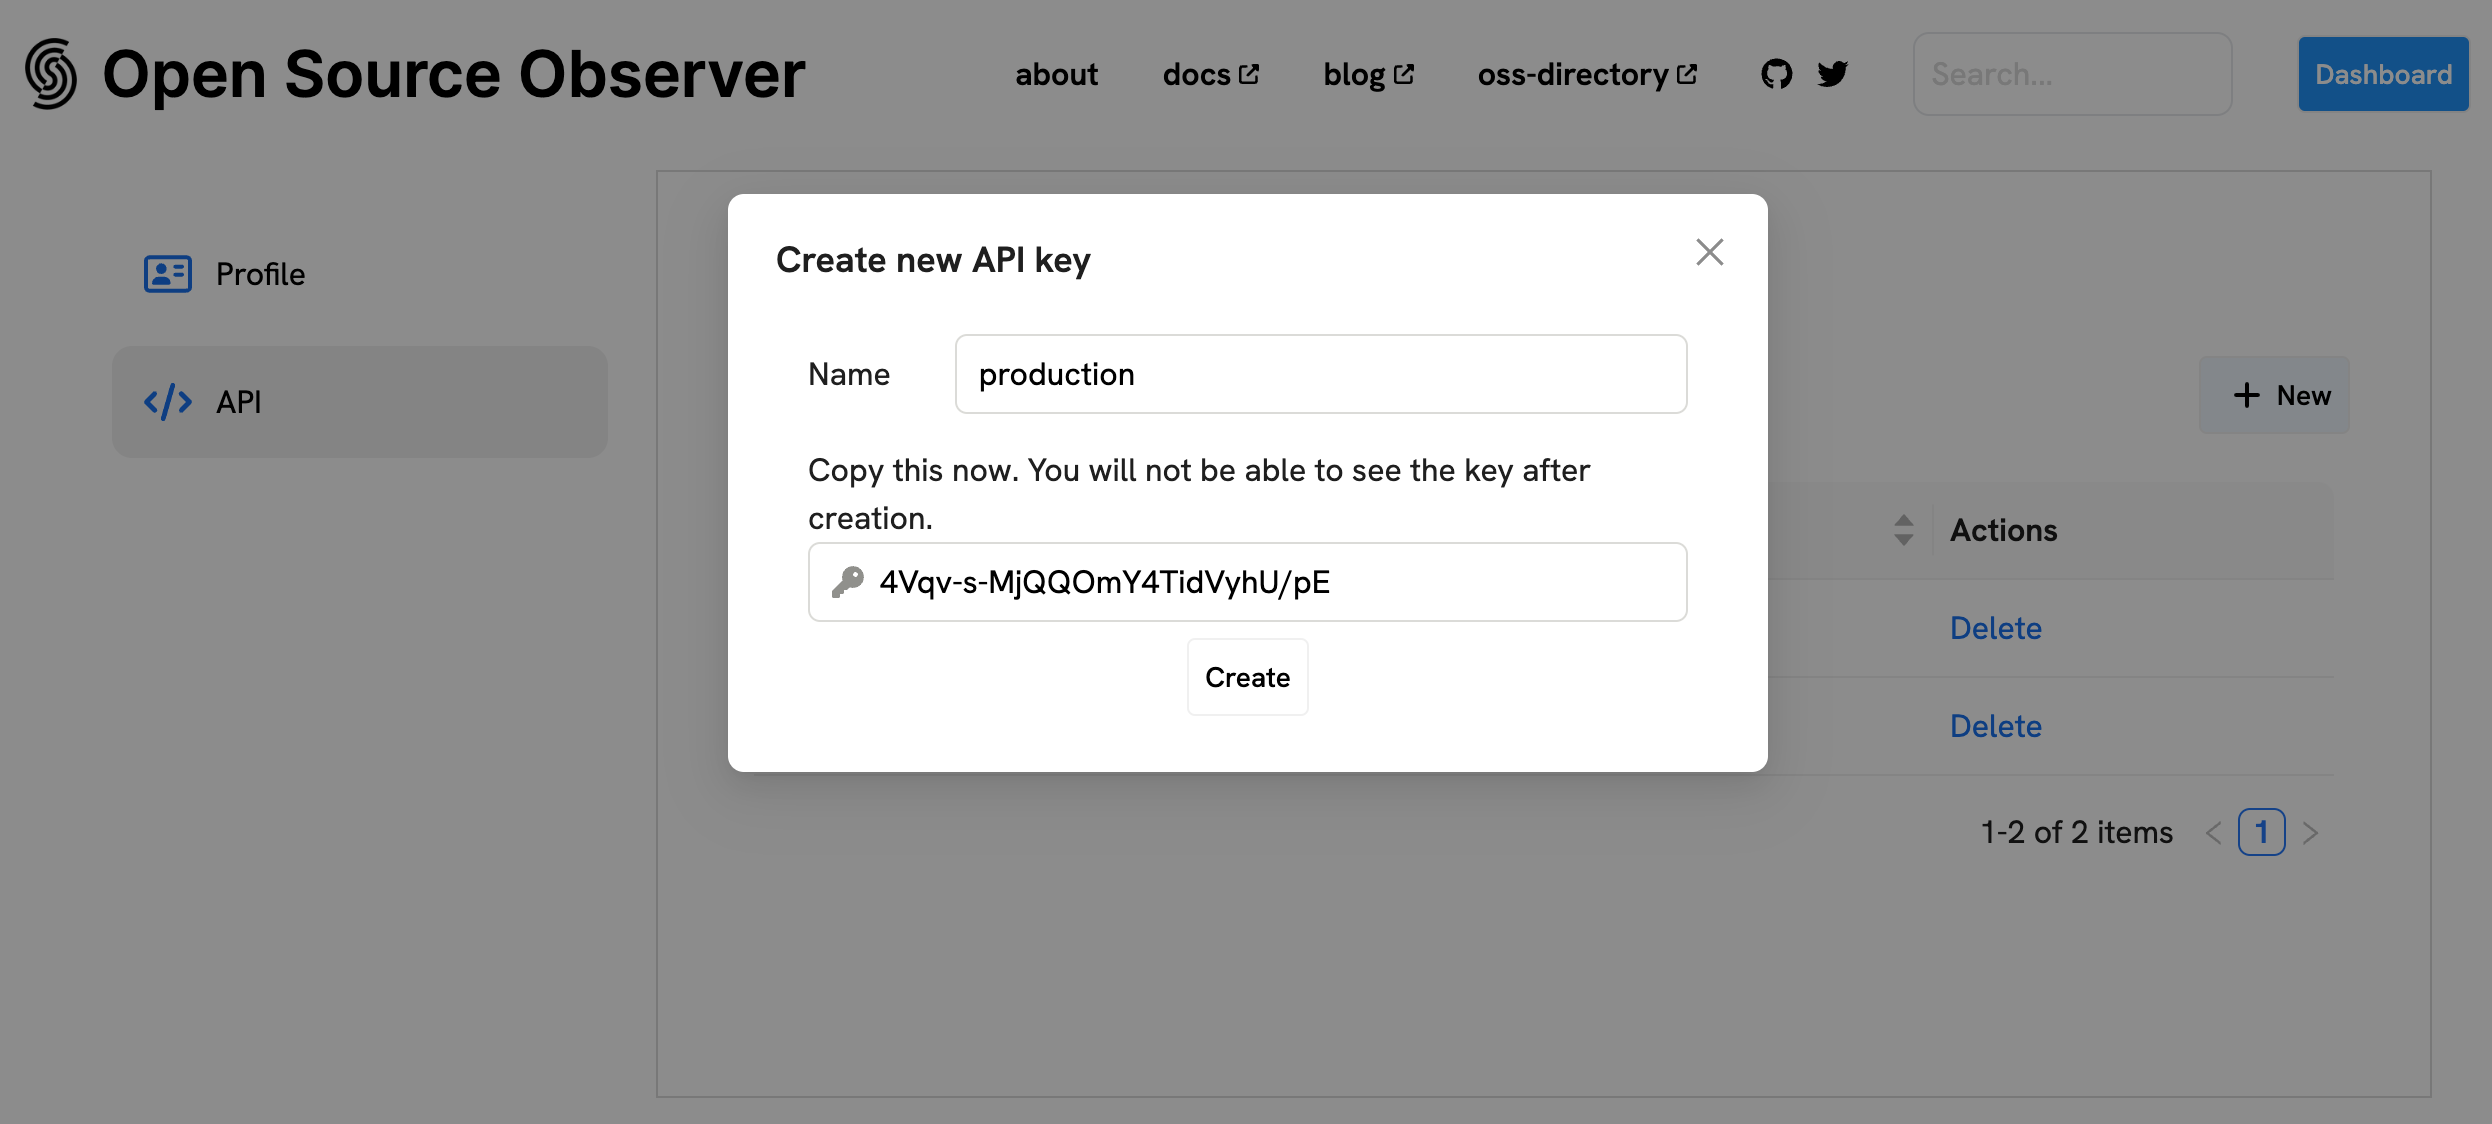
Generate an API key
First, go to www.opensource.observer and create a new account.
If you already have an account, log in. Then create a new personal API key:
- Go to Account settings
- In the "API Keys" section, click "+ New"
- Give your key a label - this is just for you, usually to describe a key's purpose.
- You should see your brand new key. Immediately save this value, as you'll never see it again after refreshing the page.
- Click "Create" to save the key.
You can create as many keys as you like.

How to Authenticate
In order to authenticate with pyoso, you have to set
the OSO_API_KEY environment variable.
os.environ["OSO_API_KEY"] = 'your_api_key'
You can also explicitly pass in your API key to the client
from pyoso import Client
client = Client(api_key=OSO_API_KEY)
Exploring the data
Every stage of the OSO data pipeline can be queried from pyoso.
All model definitions can be found under
warehouse/oso_sqlmesh/models
in our
monorepo.
You can also view the model lineage in our Dagster dashboard.
Model hierarchy
Generally speaking there are three types of models:
- Staging models and source data: For each data source, staging models are created to clean and normalize the necessary subset of data.
- Intermediate models:
Here, we join all data sources into a master event table,
int_events. Then, we produce a series of aggregations such asint_events_daily_to_project - Mart models: From the intermediate models, we create the final metric models.
Our data pipeline is under heavy development and all table schemas are subject to change. The most stable models will be versioned mart models. We will monitor usage of mart models, both to ensure quality of service and to deprecate models that are no longer used.
Please join us on Discord to stay up to date on updates.
Example queries
Feel free to copy the pyoso
quickstart Jupyter notebook
to get started quickly.
For example, to plot Uniswap transactions on OP mainnet over time:
import os
import pandas as pd
from pyoso import Client

OSO_API_KEY = os.environ['OSO_API_KEY']
client = Client(api_key=OSO_API_KEY)
query = """
   SELECT
      m.metric_name as metric_name,
      tm.sample_date as date,
      tm.amount as amount
   FROM timeseries_metrics_by_project_v0 AS tm
   JOIN metrics_v0 AS m ON tm.metric_id = m.metric_id
   JOIN projects_v1 AS p ON tm.project_id = p.project_id
   WHERE p.project_name = 'uniswap'
   ORDER BY tm.sample_date DESC
"""
df = client.to_pandas(query)
df['date'] = pd.to_datetime(df['date'])
(df.query("metric_name == 'OPTIMISM_transactions_daily'").plot(kind='line', x='date', y='amount'))
Inspecting Data Provenance
For more advanced use cases, the client.query() method returns a QueryResponse object that contains both the data and analytics metadata. This allows you to inspect the dependency tree of the data sources used in your query.
import os
from pyoso import Client

# Initialize the client
os.environ["OSO_API_KEY"] = "your_api_key"
client = Client()

# Execute a query to get a QueryResponse object
query = "SELECT * FROM artifacts_v1 LIMIT 5"
response = client.query(query)

# You can still get the DataFrame as before
df = response.to_pandas()
print("\n--- Query Data ---")
print(df)

# Now, inspect the analytics to see the dependency tree
print("\n--- Data Dependency Tree ---")
response.analytics.print_tree()
This will output a tree structure showing how the final artifacts_v1 table was constructed from its upstream dependencies, helping you understand the data's origin and freshness.
Performance/Cost optimization
Typically, downstream models are typically smaller than upstream models, like source data. So, it is generally recommended to use the model that is further downstream in the lineage graph that can satisfy your query. Each stage of the pipeline typically reduces the size of the data by 1-2 orders of magnitude.
If there is an intermediate model addition (such as a new event type or aggregation) that you think could help save costs for others in the future, please consider contributing to our data models.
Rate Limits
All requests are rate limited. There are currently 2 separate rate limit tiers:
- Anyone can make a query, subject to a standard rate limit.
- Developers who have been accepted into the Kariba Data Collective will be subject to a higher rate limit.
We are still currently adjusting our rate limits based on capacity and demand. If you feel like your rate limit is too low, please reach out to us on our Discord.